How to Use RSI (Relative Strength Index) to Identify Oversold Markets
5/3/2026
Introduction
In the volatile world of cryptocurrency trading, timing is everything. Entering a trade too late during a pump or selling too early during a dump is a common mistake that drains portfolios. To solve this, professional traders use momentum oscillators. Among the most popular is the Relative Strength Index (RSI).
Whether you are scanning pairs on Binance, Bitget, or MEXC, the RSI is a vital tool for determining if a coin is "overbought" (too expensive) or "oversold" (undervalued). By understanding how to read this 0-100 scale, you can stop chasing green candles and start entering trades at the exact moment the trend is likely to reverse.
1. What is the RSI Indicator?
The Relative Strength Index (RSI), developed by J. Welles Wilder, measures the speed and change of price movements. It compares the magnitude of recent gains to recent losses over a specific period—usually 14 days or 14 candles.
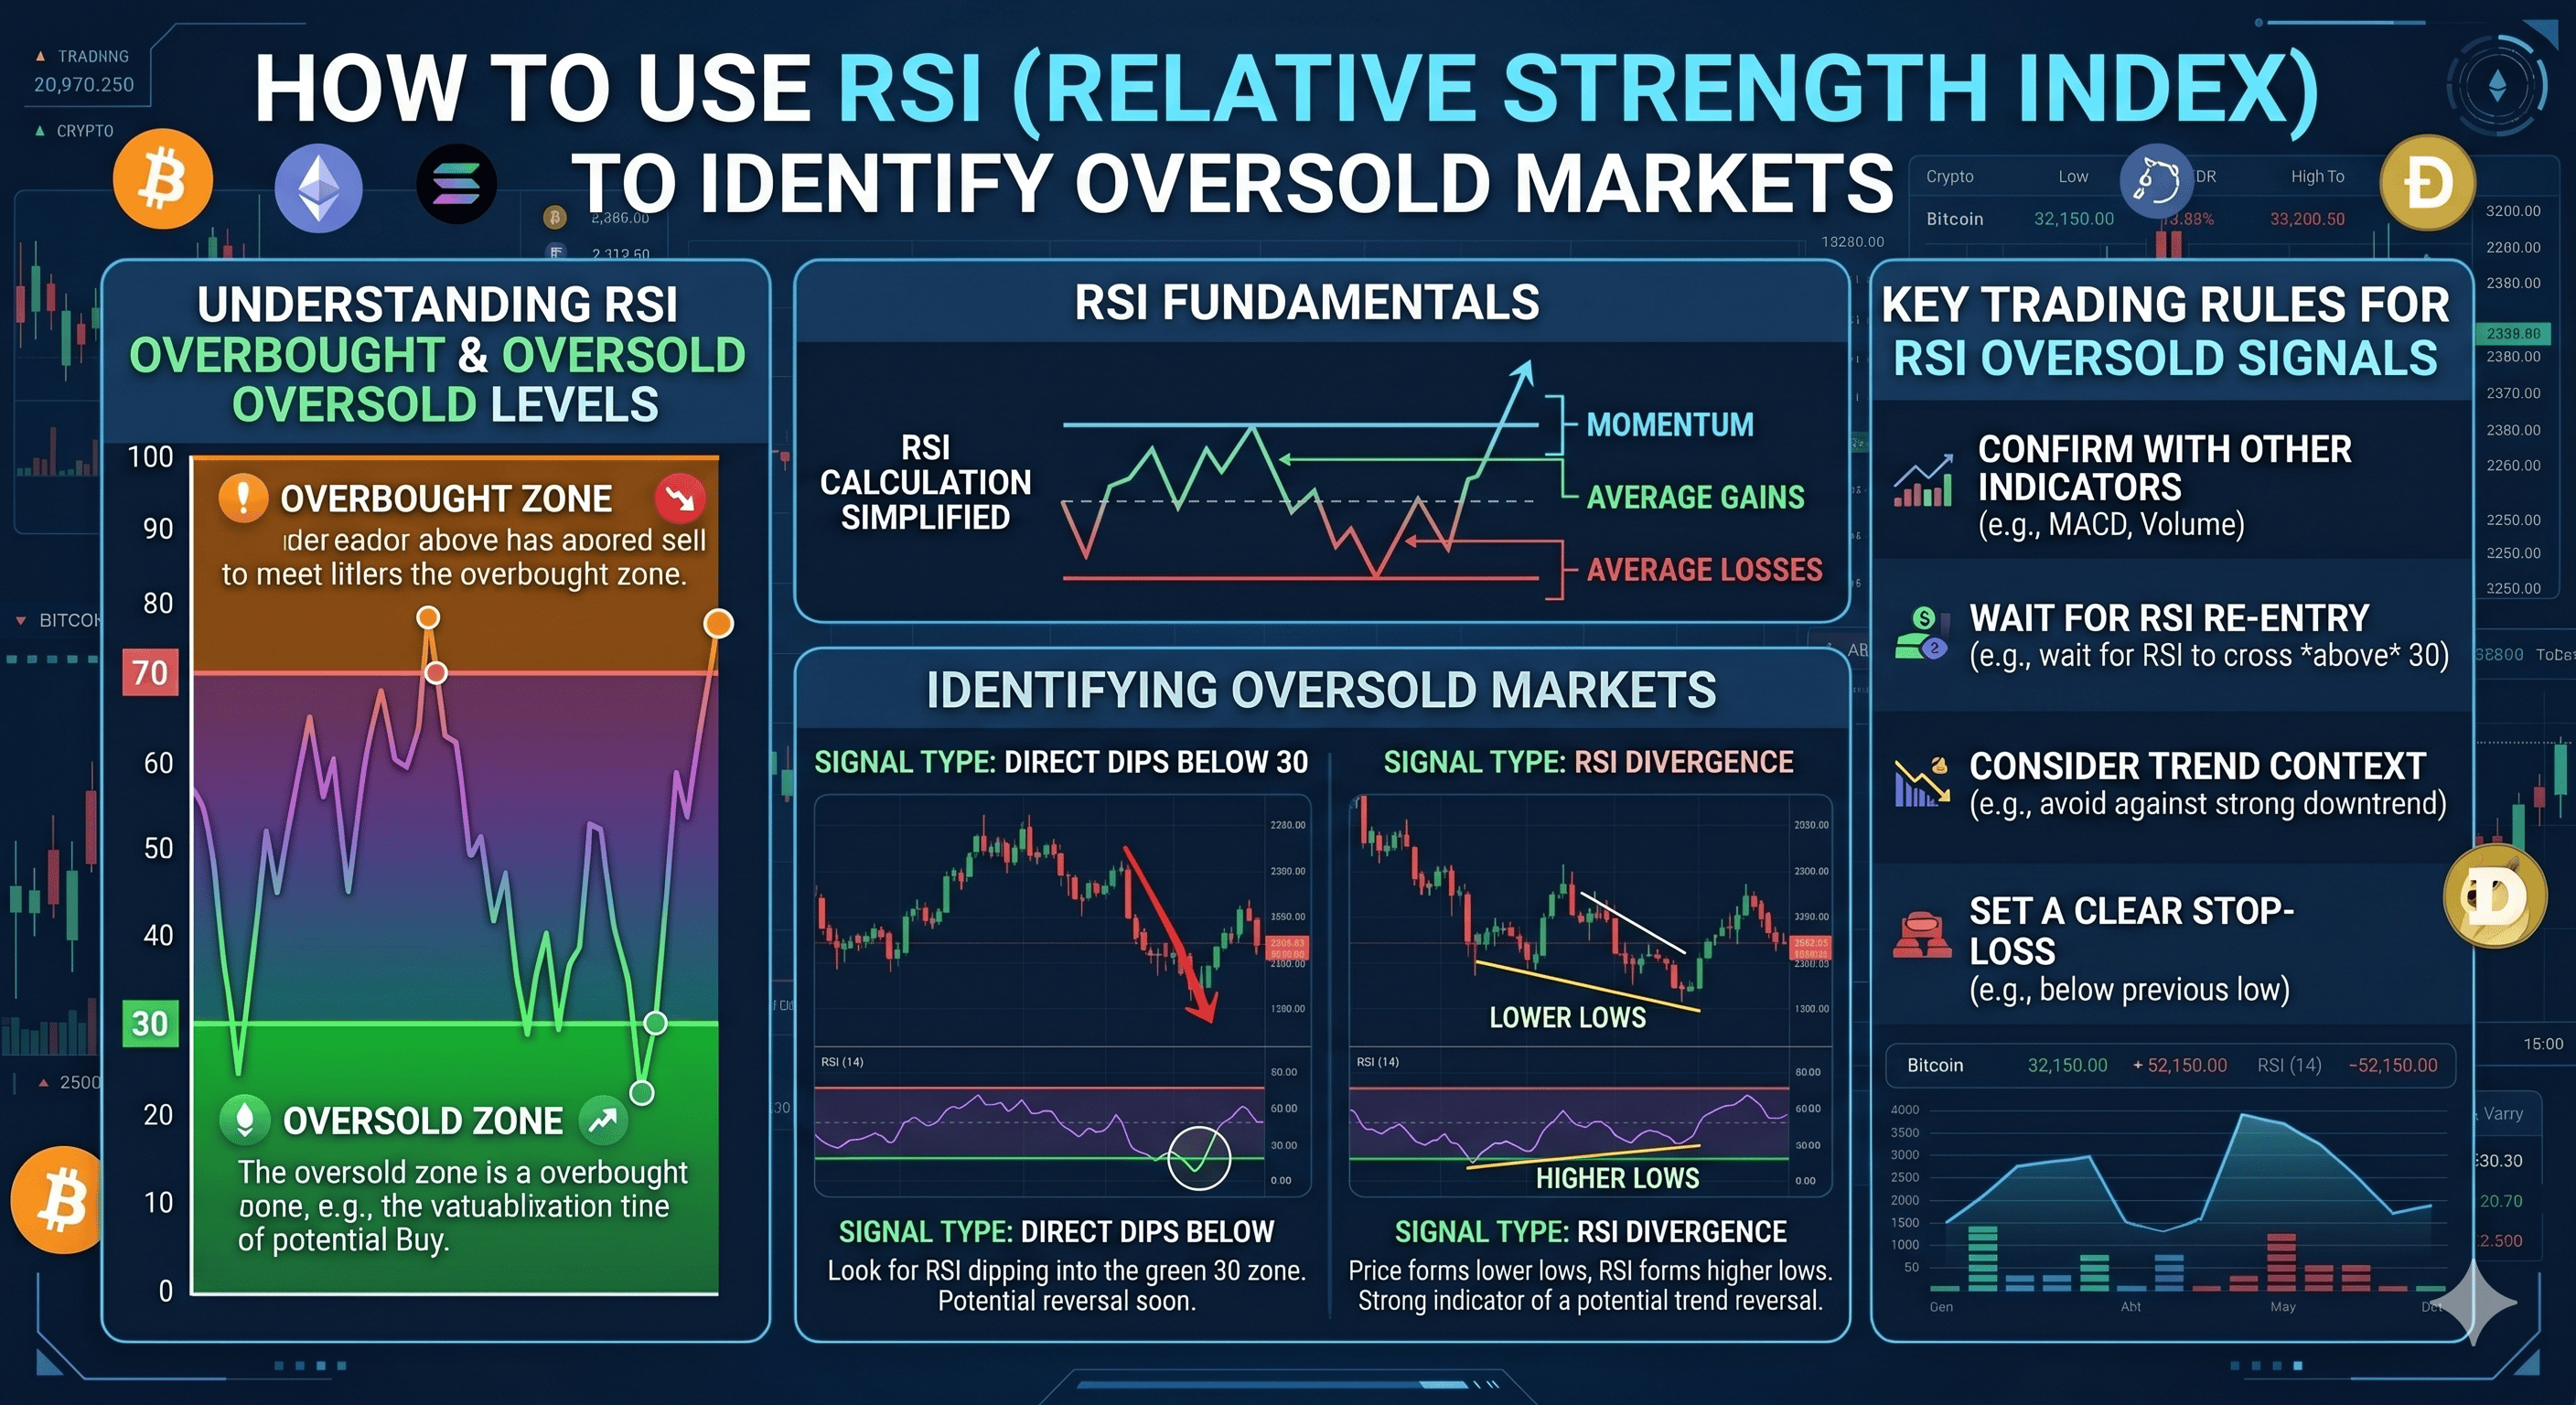
The RSI is displayed as a line graph that moves between two extremes: 0 and 100.
Traditional Overbought Level: 70
Traditional Oversold Level: 30
When the RSI line crosses these thresholds, it signals that the current price move may be reaching a point of exhaustion.
2. Identifying Oversold Conditions for Entry
For a buyer, the "Oversold" region is the gold mine. When the RSI drops below 30, it indicates that the asset has been sold aggressively and may be due for a "relief bounce" or a total trend reversal.
How to Trade the Oversold Signal on Bitget or MEXC:
The Dip: Wait for the RSI to drop below 30. This tells you the bears are in control, but they are getting tired.
The Hook: Do not buy just because the RSI is at 20. It can stay oversold for a long time during a crash. Instead, wait for the RSI line to "hook" back up and cross above 30.
Confirmation: Look at the candlestick patterns (from Post #1). If you see a Hammer candle forming while the RSI is at 25, you have a high-probability "Buy" signal.
3. The Danger of Overbought Markets
Conversely, when the RSI climbs above 70, the asset is considered overbought. This is often where "FOMO" (Fear Of Missing Out) kicks in for retail traders, but smart money starts looking for the exit.
If you are holding a position on Binance and see the RSI hitting 85 or 90 on the 1-hour chart, it is usually a wise move to tighten your Stop Loss or take partial profits. The higher the RSI, the more "stretched" the price is from its mean, and a correction is statistically imminent.
4. Advanced Strategy: RSI Divergence
This is one of the most powerful "secret weapons" for expert traders. Divergence happens when the price of a crypto asset and the RSI indicator move in opposite directions.
Bullish Divergence: The price makes a Lower Low, but the RSI makes a Higher Low. This shows that even though the price is dropping, the selling momentum is actually weakening. This is a massive "Buy" signal.
Bearish Divergence: The price makes a Higher High, but the RSI makes a Lower High. This warns you that the uptrend is losing steam, and a crash is likely.
Divergence is a leading indicator, meaning it often predicts the move before it happens on the price chart.
5. Setting Your Entry, Stop Loss, and Take Profit
To integrate RSI into your automated signal logic, use these parameters:
Entry Price: Market price when RSI crosses back above 30 from below.
Stop Loss: Place it just below the recent "swing low" price that occurred while the RSI was oversold.
Take Profit: A safe target is the RSI 50 level (the midline) or the RSI 70 level if the market trend is strongly bullish.
6. RSI in 2026: The Role of AI and Filters
In today’s market, simple RSI crossovers can sometimes result in "fakeouts." To increase your win rate, combine RSI with a Trend Filter.
Rule: Only take RSI "Oversold" buy signals if the price is also above the 200-period Exponential Moving Average (EMA). This ensures you are buying the dip in a healthy uptrend rather than trying to catch a falling knife in a bear market.
Conclusion
The RSI is a versatile and essential indicator for any crypto trader using Binance, Bitget, or MEXC. By mastering the 30/70 levels and watching for divergences, you gain a massive edge over traders who trade based on emotion. Remember: RSI tells you when the market is "exhausted"—and exhaustion is where the best profit opportunities are born.